Investing involves risk. Market downturns will happen. Having a sound investment strategy can help smooth out the turbulence in your portfolio and save you from getting caught up in a herd mentality of selling low into a down market. What’s the best approach?
There are a number of possible answers. Hedging is one popular strategy for mitigating the effects of market downturns. Before we talk more about hedging though, let’s examine recent market history to help illustrate the inherent market risks we face every day.
Downturns and Volatility in the U.S. Equity Market
Since 1980, there have been numerous market corrections (defined as a drop of 10% or more) and six bear markets (declines of 20% or more). In the 1980s, we had the Latin American debt crisis and the stock market crash of 1987. The 1990s were spared any defined bear markets, but they were followed by the technology bubble and the Financial Crisis in the 2000s. In late 2018, the equity market battled a deep correction that nearly entered bear market territory as it digested Fed rate hikes, trade tensions between the U.S. and China, and renewed volatility. In early 2020, we experienced a sharp bear market driven by the COVID-19 pandemic. Equity markets fell into bear market territory again in 2022, spurred by inflationary fears, and slowing global economic growth. More recently, in the first quarter of 2025, robust equity markets faltered in the face of stubbornly persistent inflation, an uncertain global trade environment, and increased volatility.
S&P 500 Price Levels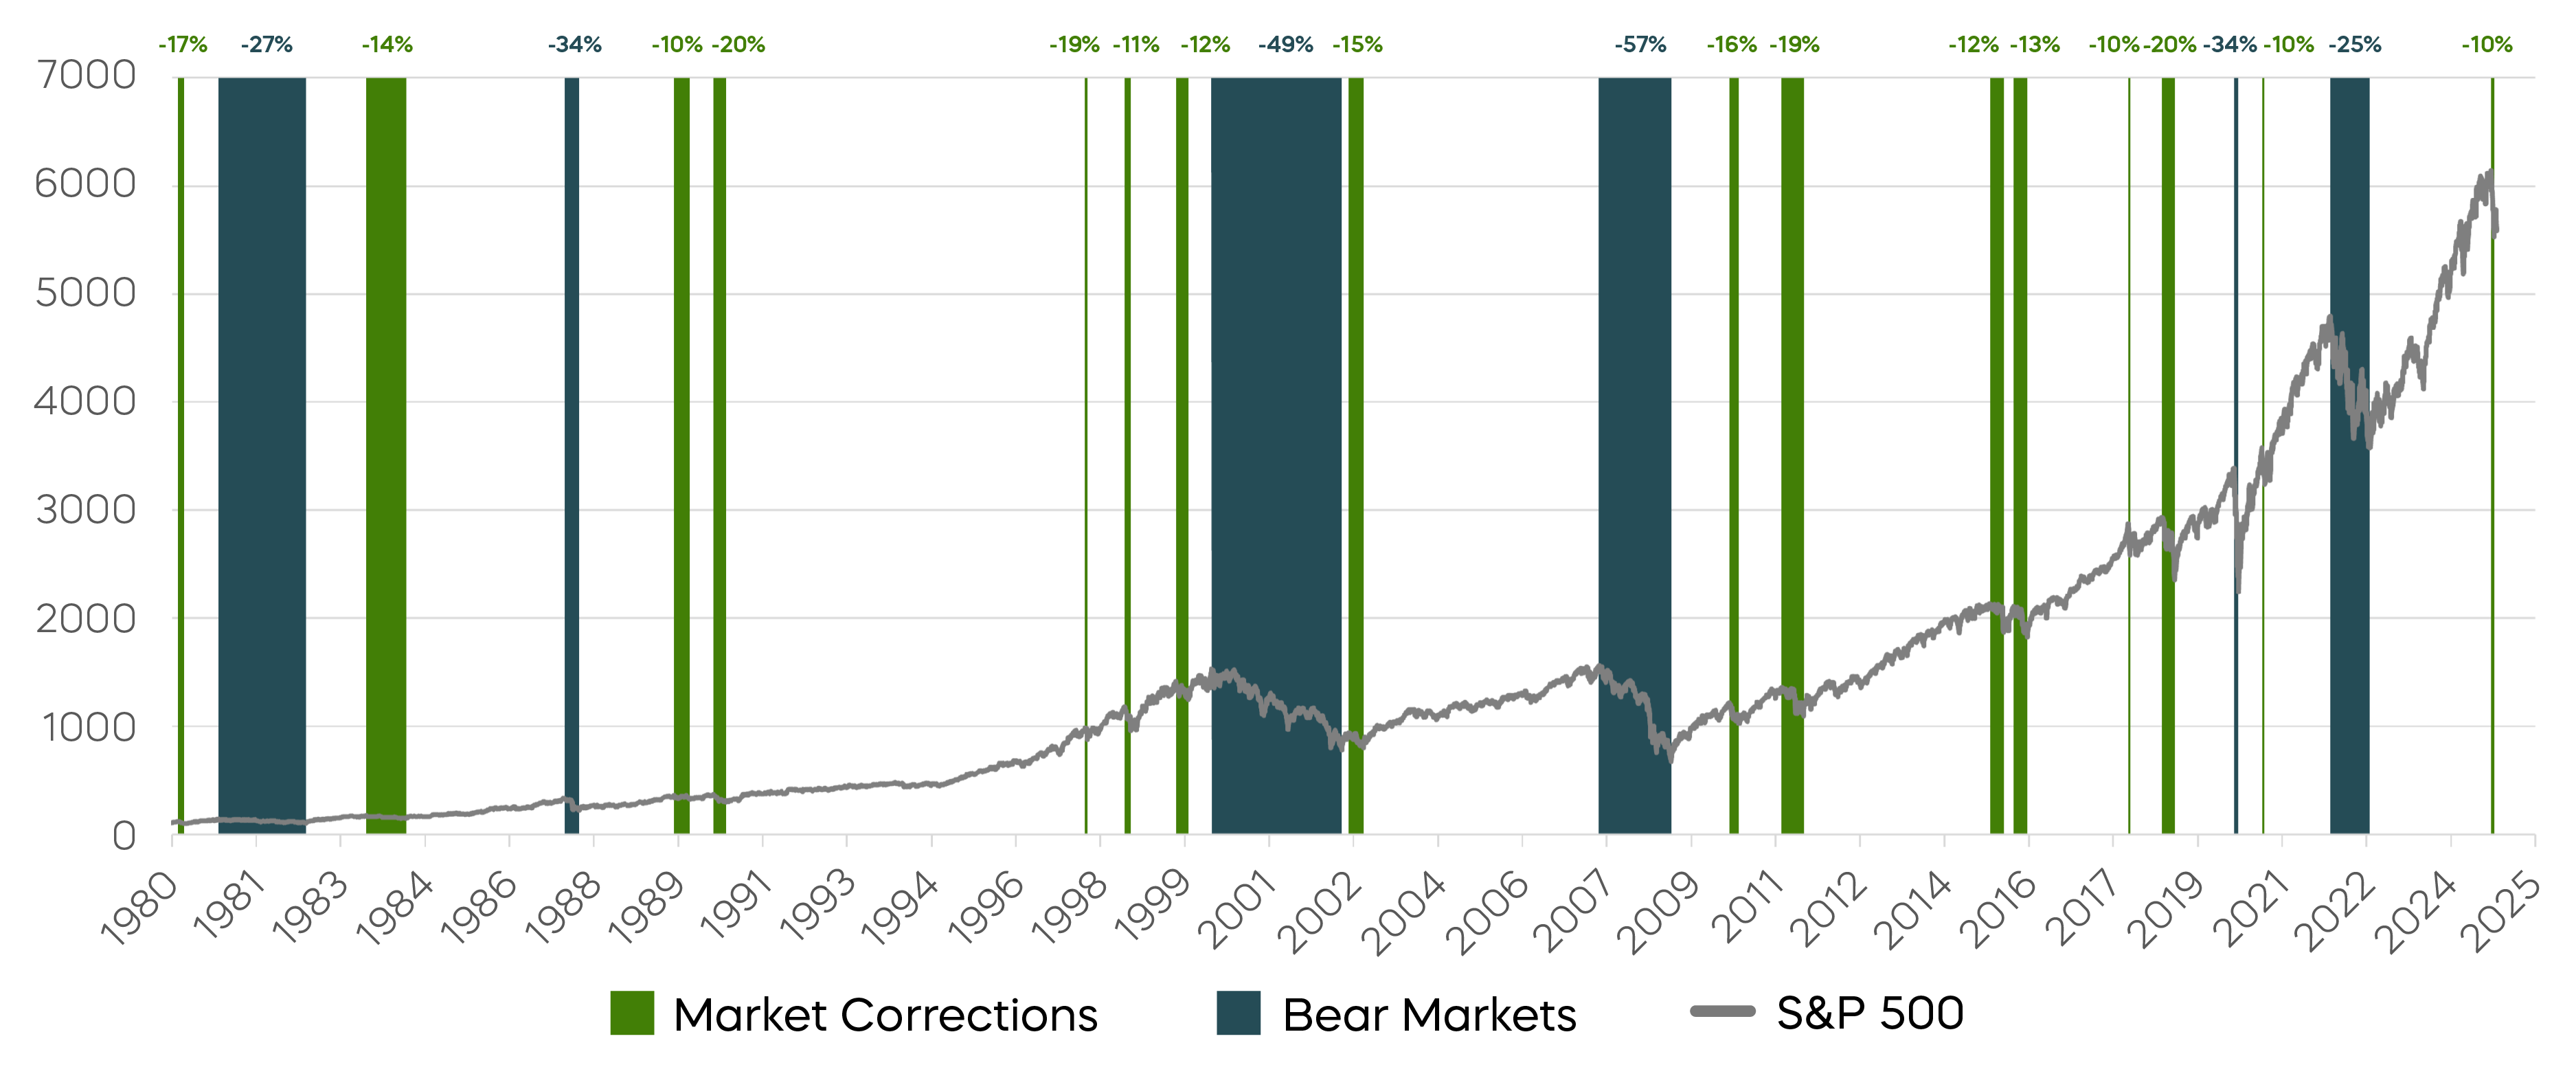
Source: Bloomberg, as of 3/31/2025
Volatility in financial markets reached historically significant levels in 2020 as COVID-19 impacted the economy, public health, and daily life in the U.S. and around the world. This volatility was of similar magnitude to what was experienced during the 2008 Financial Crisis and Market Crash of 1987.
S&P 500, Three-month Rolling Volatility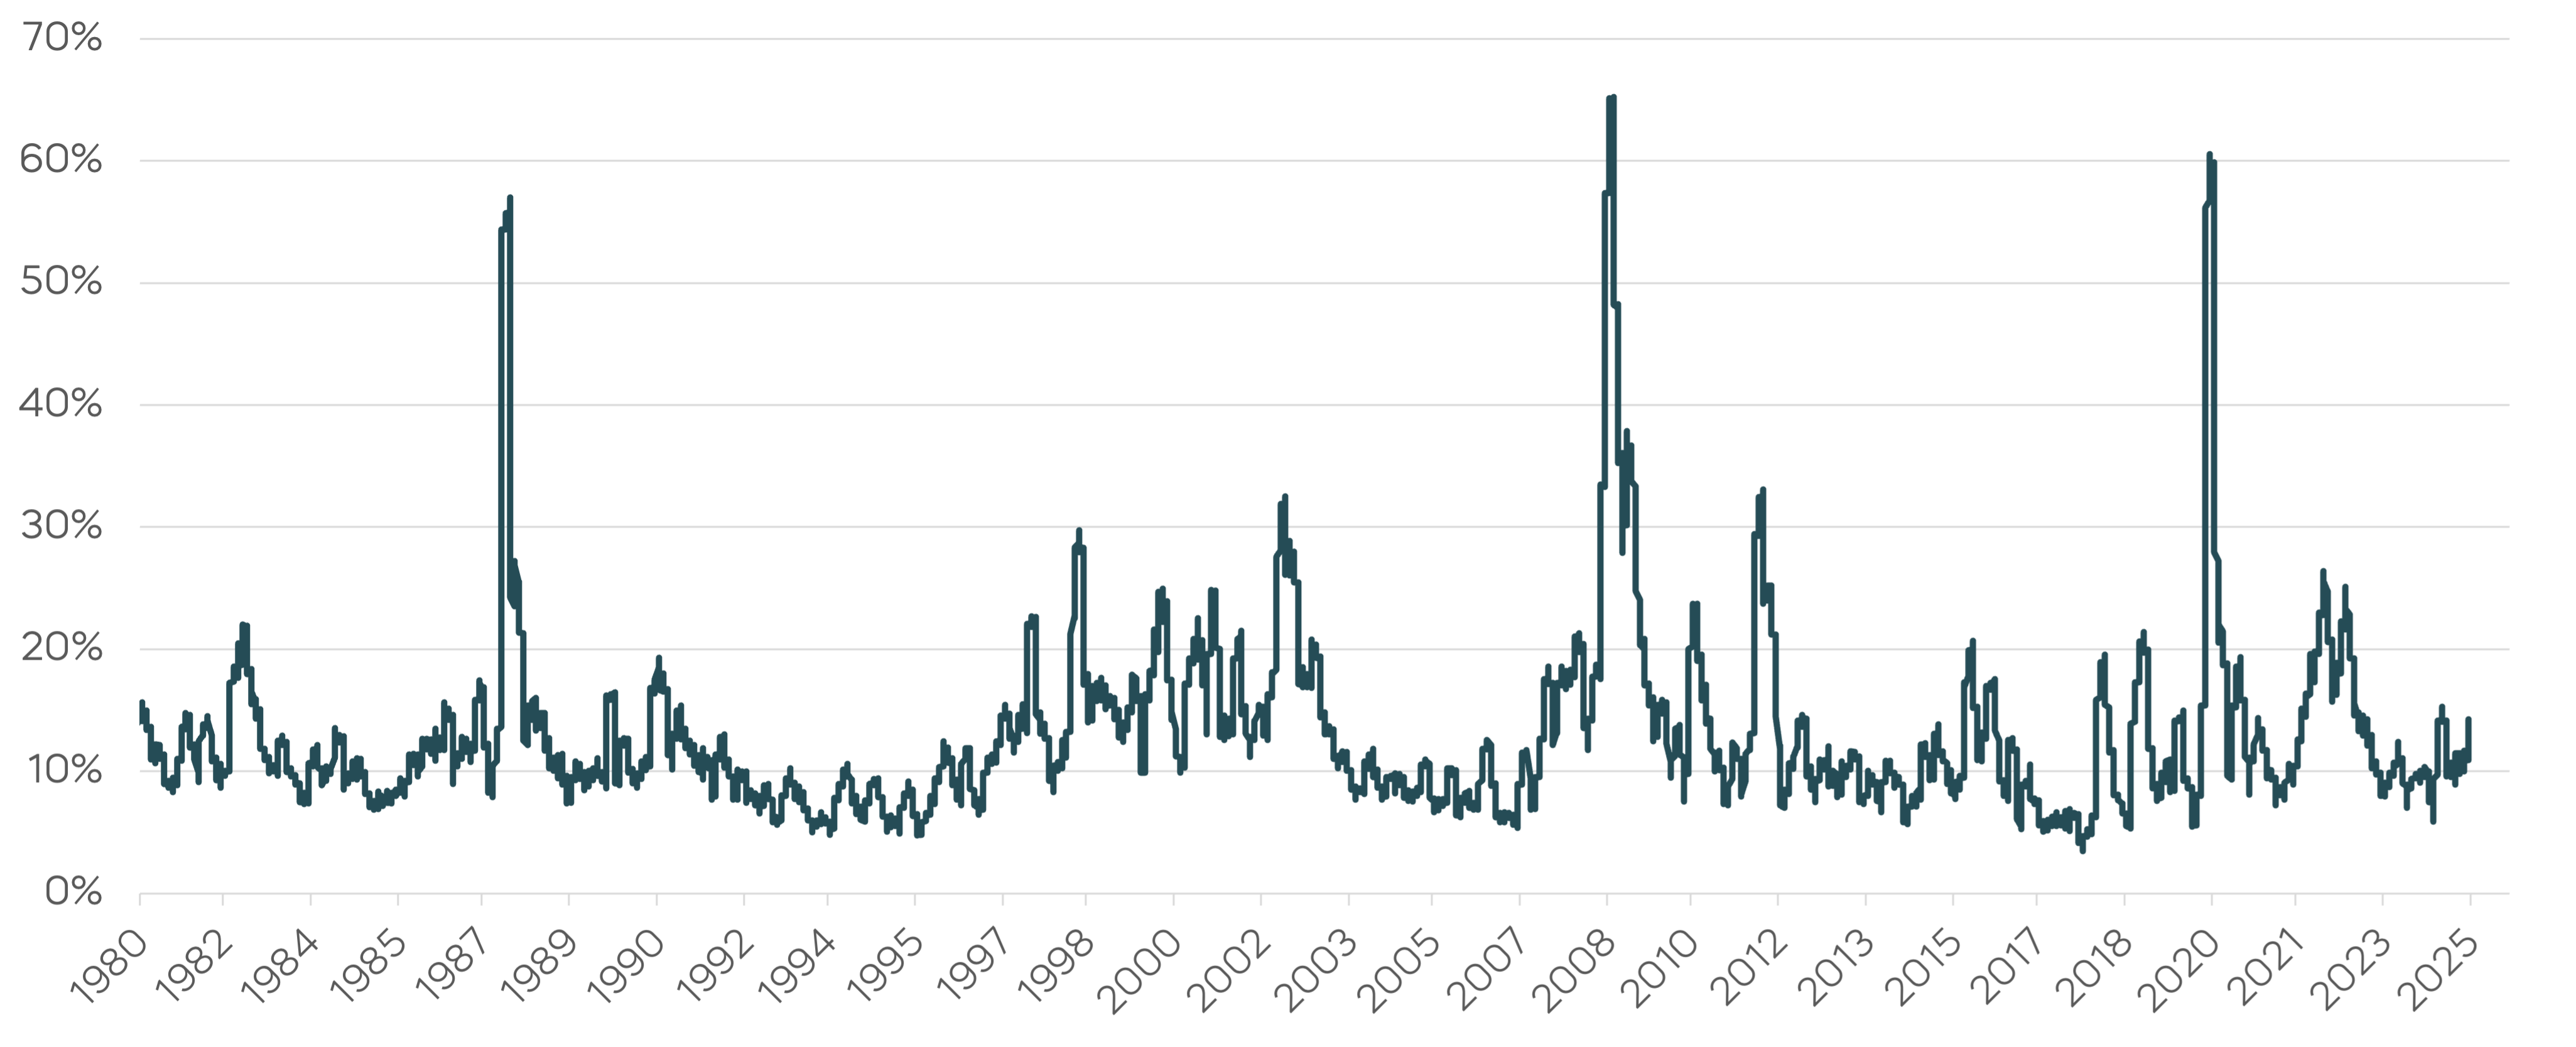
Source: Bloomberg, as of 3/31/2025. Calculated as the standard deviation of 3- month (63 trading days) rolling returns based on daily S&P 500 returns, annualized to 252 trading days in a year.
Navigating Fixed Income in a New Rate Regime
While bond yields had been on a downward trajectory dating back to 1981, they hit historically low levels in 2020 as a result of the pandemic’s impact on the economy and financial markets. The Federal Reserve lowered the Fed Funds target rate to 0.00–0.25%. In 2020, 10- and 30-year Treasury yields fell as low as 0.51% and 1.00%, respectively.[1] This had many investors wondering how much lower yields could go. It also presented challenges for investors managing fixed income exposure and portfolios. Treasury yields subsequently rose off the historically low levels as the economy recovered with the help of supportive monetary and fiscal policies. In the first half of 2022, the Fed started pursuing tighter monetary policies amid high inflation, and Treasury yields moved meaningfully higher, which can lead to losses (potentially significant) in bond portfolios. Intermediate and long-term U.S. Treasury indexes declined 11% and 22%, respectively, for the first half of the year.[2] These losses came at a time where equities also suffered, leaving many investors relying on traditional diversification with stocks and bonds with meaningful losses in their portfolios. More recently, over the last 12- months, as of 3/31/2025, 10-year Treasury yields fluctuated from a low of 3.62% to a high of 4.79%, due in part to growing macroeconomic uncertainty and worries over the impact of increasing tariffs on global trade.[3]
Fed Funds Rate and Treasury Yields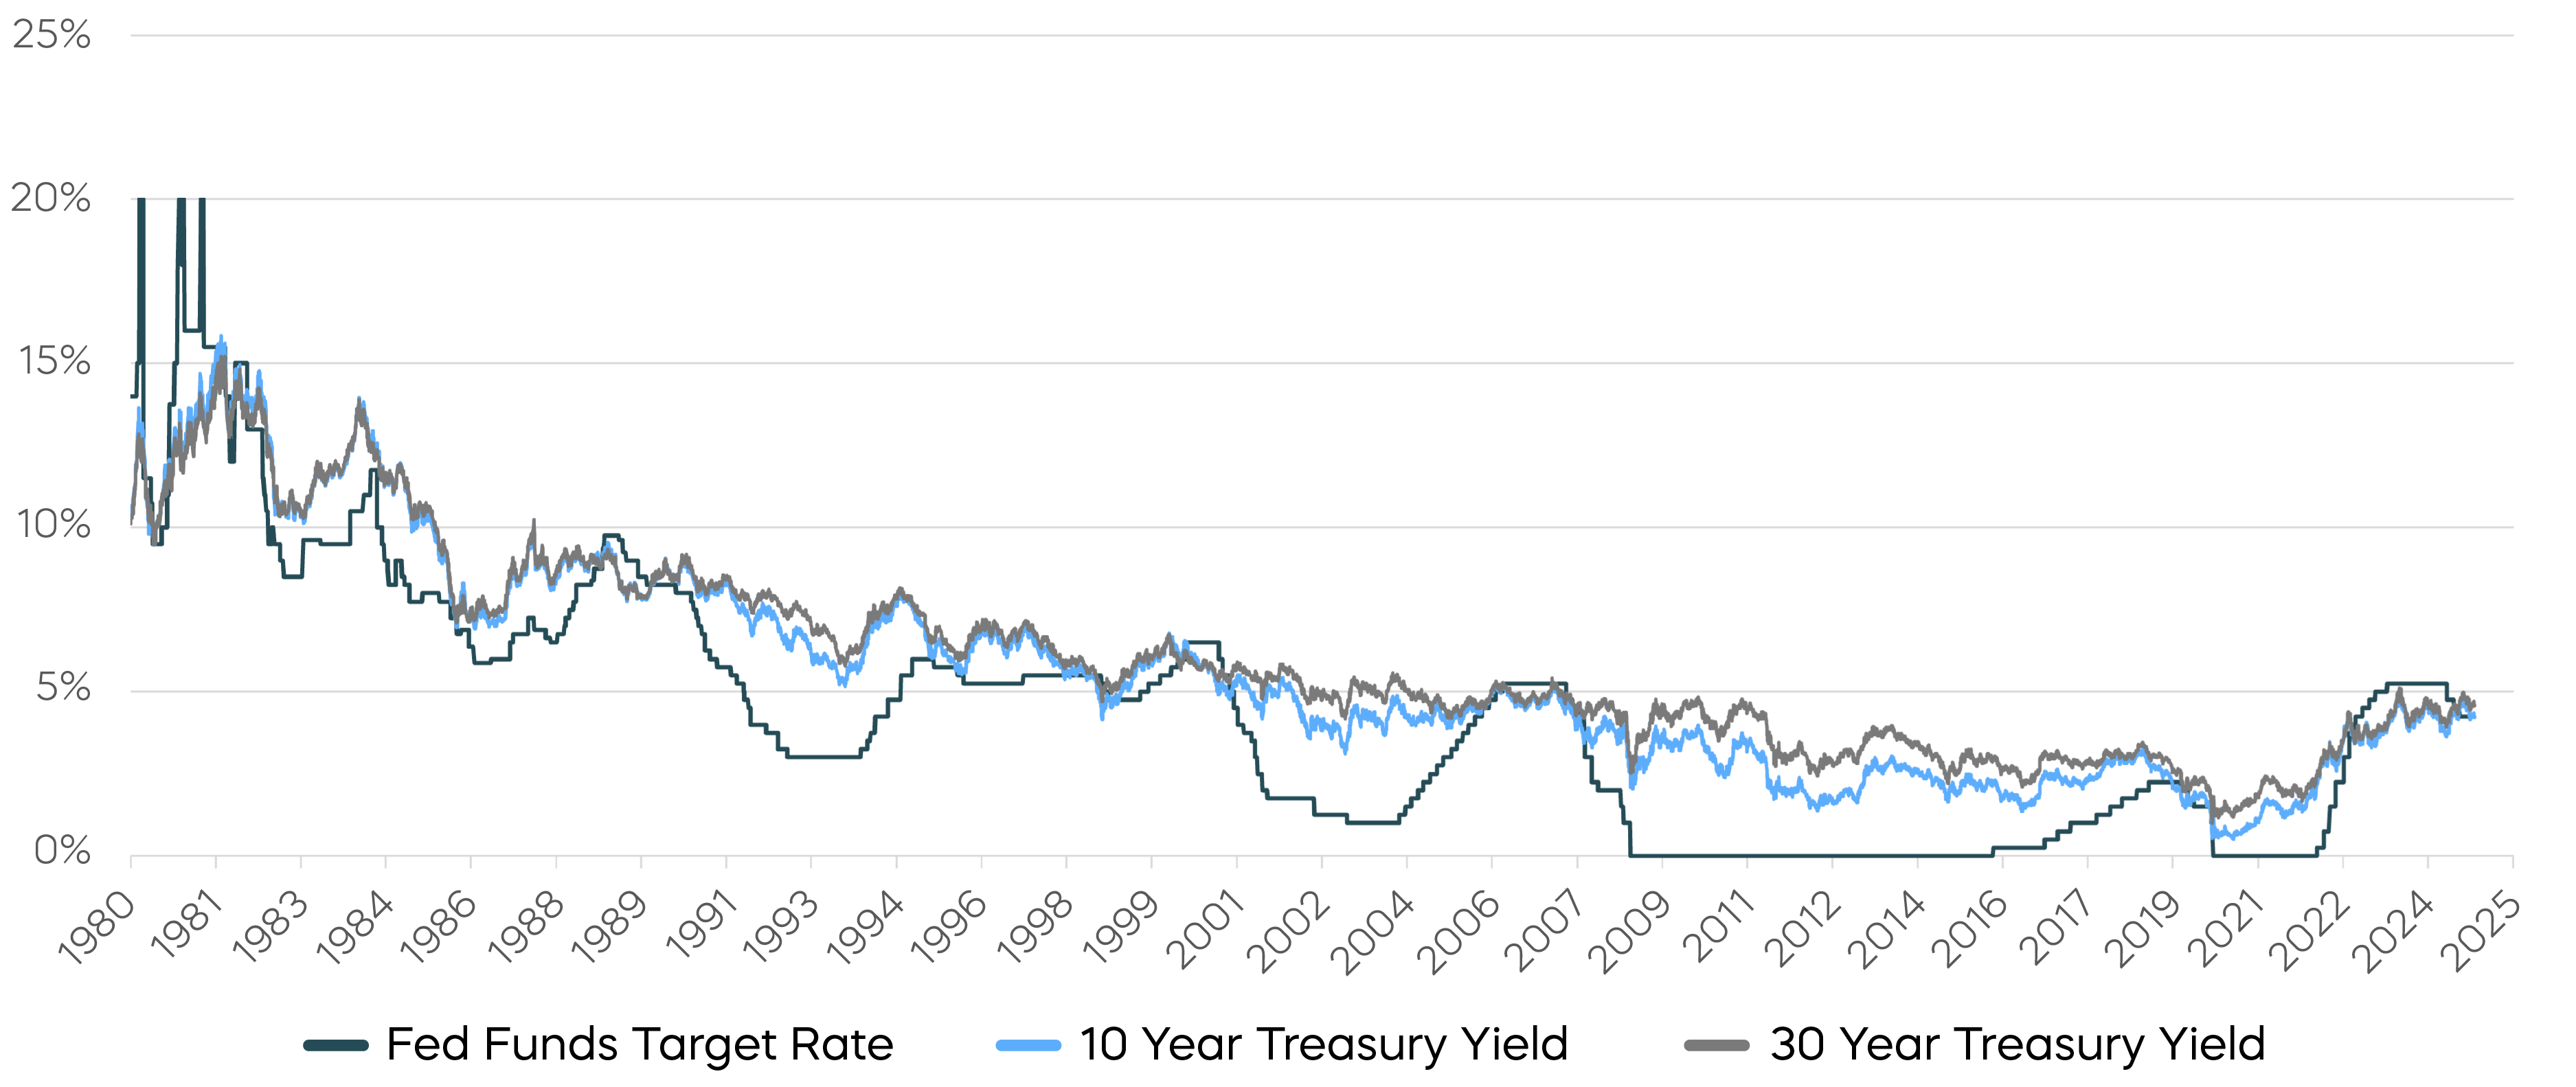
Source: Bloomberg, as of 3/31/2025
Portfolio Hedging to Mitigate the Effects of Market Downturns
Investors can consider hedging strategies to mitigate market risk. A hedge, in its simplest form, is an investment intended to move in the opposite direction of an asset in your portfolio that you consider to be at risk. A hedge provides inverse exposure. If the at-risk investment should decline in value, the hedge is designed to increase in value and offset potential losses in your portfolio.
Hedging is a flexible strategy. You can apply it broadly in an effort to help minimize loss across entire asset classes in your portfolio—to help shield your equity, fixed income, commodity or even currency allocations. Or, you can hedge narrowly to help shield individual sectors or even specific stocks. There are a number of hedging strategies available, and the best one for you will depend on your specific needs, goals and tolerance for risk.
Used strategically, portfolio hedging can become part of your long-term investment strategy. Deployed tactically, a hedge can be applied and removed as needed, without disturbing your core strategy or long-term goals, to help provide short-term shelter from adverse market events. Hedging your portfolio can provide you with an alternative to selling in a down market, realizing investment losses, and potentially generating significant redemption fees, transaction costs and tax consequences. Of course, hedging strategies have unique risks, costs and consequences of their own (e.g., fund management fees, rebalancing costs, taxable events, etc.). It is important that you fully understand the strategy you plan to use and read the prospectuses for any investments you intend to use as a hedge.
[1] Source: Bloomberg
[2] Source: Bloomberg, intermediate and long-term U.S. treasury indexes measured using ICE US 7-10 and 20+ year US Treasury indexes.
[3] Source: Bloomberg
Read More
In Part II: Strategies for Hedging Your Portfolio, we delve deeper into the concept of portfolio hedging. We discuss the pros and cons of several common hedging strategies, and we show you why we believe that inverse funds may offer the superior solution. In Part III: The Efficacy of Hedging with Inverse ETFs, we provide concrete examples across asset classes to show you how effectively inverse ETFs can mitigate the effects of market downturns.
|
INDEX/BENCHMARK |
DAILY OBJECTIVE |
|||
|
UltraPro Short |
UltraShort |
Short |
||
|
-3x |
-2x |
-1x |
||
|
BROAD MARKET |
||||
|
S&P 500 |
||||
|
NASDAQ-100 |
||||
|
NASDAQ-100 Mega |
-- | -- | ||
|
Dow Jones Industrial Average |
||||
|
S&P MidCap 400 |
||||
|
S&P SmallCap 600 |
-- |
|||
|
Russell 2000 |
||||
|
SECTOR |
||||
|
Dow Jones U.S. Basic Materials |
-- |
-- |
||
|
NASDAQ Biotechnology |
-- |
-- |
||
|
S&P Communication Services Select Sector |
-- |
-- |
||
|
Dow Jones U.S. Consumer Goods |
-- |
-- |
||
|
Dow Jones U.S. Consumer Services |
-- |
-- |
||
|
Dow Jones U.S. Financials |
-- |
|||
|
Dow Jones U.S. Health Care |
-- |
-- |
||
|
Dow Jones U.S. Industrials |
-- |
-- |
||
|
Dow Jones U.S. Oil & Gas |
-- |
-- |
||
|
Dow Jones U.S. Real Estate |
-- |
|||
|
Solactive-ProShares Bricks and Mortar Retail Store |
-- |
-- |
||
|
Dow Jones U.S. Semiconductors |
-- |
-- |
||
|
Dow Jones U.S. Technology |
-- |
-- |
||
|
Dow Jones U.S. Select Telecommunications |
-- |
-- |
-- |
|
|
Dow Jones U.S. Utilities |
-- |
-- |
||
|
INTERNATIONAL |
||||
|
MSCI EAFE |
-- |
|||
|
MSCI Emerging Markets |
-- |
|||
|
FTSE Developed Europe All Cap |
-- |
-- |
||
|
MSCI Brazil 25/50 Capped |
-- |
-- |
||
|
FTSE China 50 |
-- |
|||
|
MSCI Japan |
-- |
-- |
||
|
FIXED INCOME |
||||
|
ICE U.S. Treasury 20+ Year Bond |
||||
|
ICE U.S. Treasury 7-10 Year Bond |
-- |
|||
|
Markit iBoxx $ Liquid High Yield |
-- |
-- |
||
|
COMMODITY |
||||
|
Bloomberg WTI Crude Oil Subindex |
-- |
-- |
||
|
Bloomberg Natural Gas Subindex |
-- |
-- |
||
|
Bloomberg Gold Subindex |
-- |
-- |
||
|
Bloomberg Silver Subindex |
-- |
-- |
||
|
CURRENCY |
||||
|
EUR/USD 4:00 p.m. ET exchange rate |
-- |
-- |
||
|
JPY/USD 4:00 p.m. ET exchange rate |
-- |
-- |
||
|
CRYPTO-LINKED |
||||
|
Bloomberg Bitcoin Index |
-- |
|||
|
Bloomberg Ethereum Index |
-- |
|||
|
THEMATIC |
||||
|
Nasdaq-100 Mega Index |
-- |
-- | ||